What is ATV/OTV?
ATV/OTV stands for acoustic televiewer and optical televiewer. This type of data produces high-resolution and continuous 360-degree images of the borehole wall. These images provide a combination of qualitative and quantitative information of the borehole wall that can be used to characterise planar (at the borehole scale) features (fractures, bedding, joints, lithologic boundaries). Televiewer images can be correctly orientated by determining the borehole azimuth and inclination, allowing the dip and dip direction to be calculated for each identified geological feature.
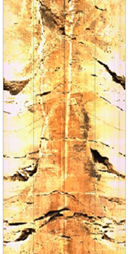
ATV images are generated using an acoustic probe. The probe transmits an ultrasonic pulse from a fixed transducer with a rotating mirror. The amplitude and travel time of the signal reflected at the interface between the borehole fluid and borehole wall is recorded to produce the ATV image. Below is an ATV image.
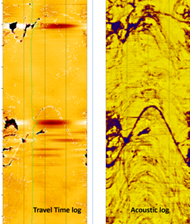
OTV images are generated using a prism and a camera housed within a ring of lights which illuminates the borehole wall as the tool moves down the borehole to collect the image. Below is an OTV image.
What does it help us understand?
Televiewer data is used to accurately evaluate the structural properties of rock mass. Optical imaging allows us to directly view the characteristics of the borehole wall and assess the relationship between lithology, foliation, and bedding, which may not always be clear on acoustic imaging if there is not a sufficient acoustic contrast. Acoustic imaging provides clearly defined fracture imaging which can be easily orientated to provide dip and dip direction. A combined approach of using both optical and acoustic televiewer data provides a powerful workflow to evaluate geotechnical rock mass properties.
What are the benefits of televiewer data?
High-level accuracy
Traditional core logging and orientation techniques require a logger to measure and assess the nature of every structure in the core. There is a resolution limit to which the manual interpretation of structural orientations can be obtained typically in the range of 2 to 5degrees. This resolution limit leads to broad disperse structural sets with less certainty. Using televiewer data significantly improve resolution of structural orientation with interpretation to 0.1 of a degree. Orientations and depths of structures are automatically calculated using the software package WellCAD.
The ATV/OTV data also provides structural orientation within the transitional / broken rock mass zones which are normally difficult to obtain manual orientations through.
Fracture zone characterisation
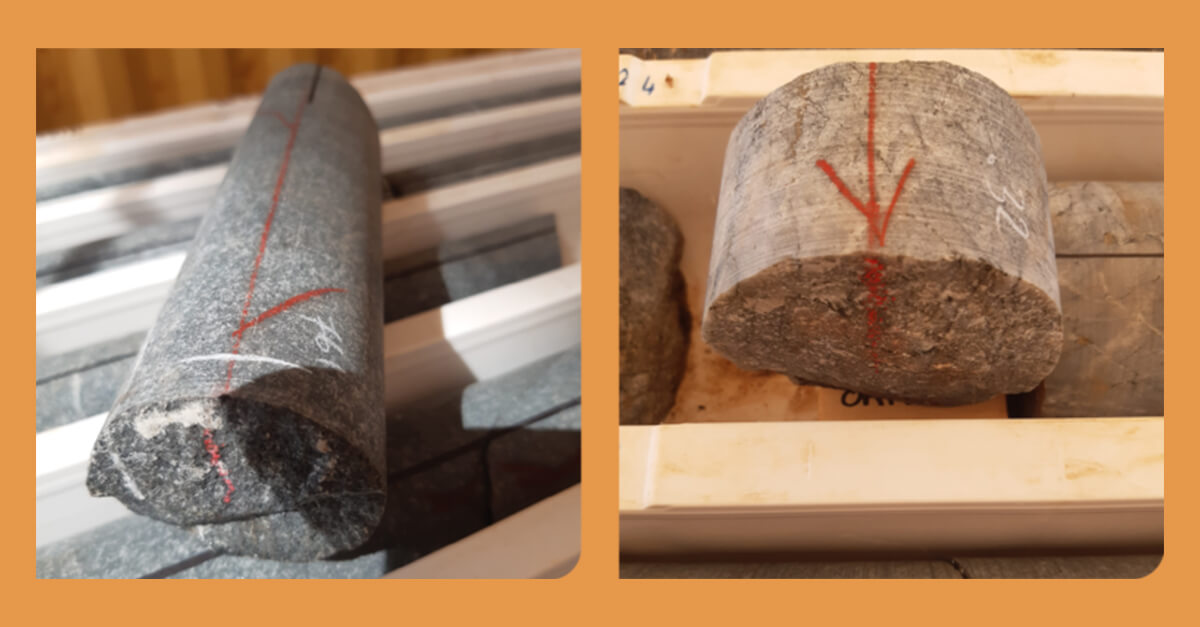
True thickness and orientation of fracture zones is essential for geotechnical analysis particularly when considering overall pit slope stability. However, it can be difficult to characterise fracture zones using core samples as the core may not be orientated or may be missing due to intensely fractured core. Structurally orientated acoustic televiewer data can provide a solution to this issue as fracture zone true thickness, true dip and dip direction can be easily assessed from the data.
Time-efficient and cost-effective
Creating a structural database using televiewer data is time efficient and cost effective in comparison to using manual core orientation techniques as less time is spent orientating and measuring the core.
Key steps in doing ATV/OTV analysis
ATV and OTV data are collected and the resultant logs are processed simultaneously using the analysis software WellCAD. Structural or lithological features are manually identified within the televiewer images and a sinusoidal trace is interactively fitted to each feature. Each feature must be appropriately classified, for example as an open or closed joint. WellCAD automatically records the apparent dip, azimuth and aperture of each feature and assigns a tadpole which graphically displays the corresponding feature dip and azimuth. It is important to correctly classify and differentiate open structures from the greater number of closed structures which are most likely present within the acoustic televiewer images. To ensure a robust interpretation workflow, an integrated approach should be taken and if available, core photos and rock mass geotechnical logging information should be viewed as the televiewer data is being processed.
Once all the features have been identified and classified, the true orientation of the features is calculated automatically in WellCAD using the borehole orientation dip and azimuth information which is collected using a gyro survey.
This video illustrates how planar geological features are identified on OTV and ATV data, and how sinusoidal traces are interactively fitted to these features to identify and classify them.
The correctly orientated picked features can be plotted graphically on a stereonet plot (such as the one below) to present a detailed overview of the structural and lithological features of the subsurface.

Written by Lauren Goodall, our geophysicist.
View her profile >
The MGT Way is engineering advice
grounded in rigorous data analysis, enabling robust design.
Contact Us >
Our Services >
Meet the Team >
Explore Our Projects >